Table of Contents
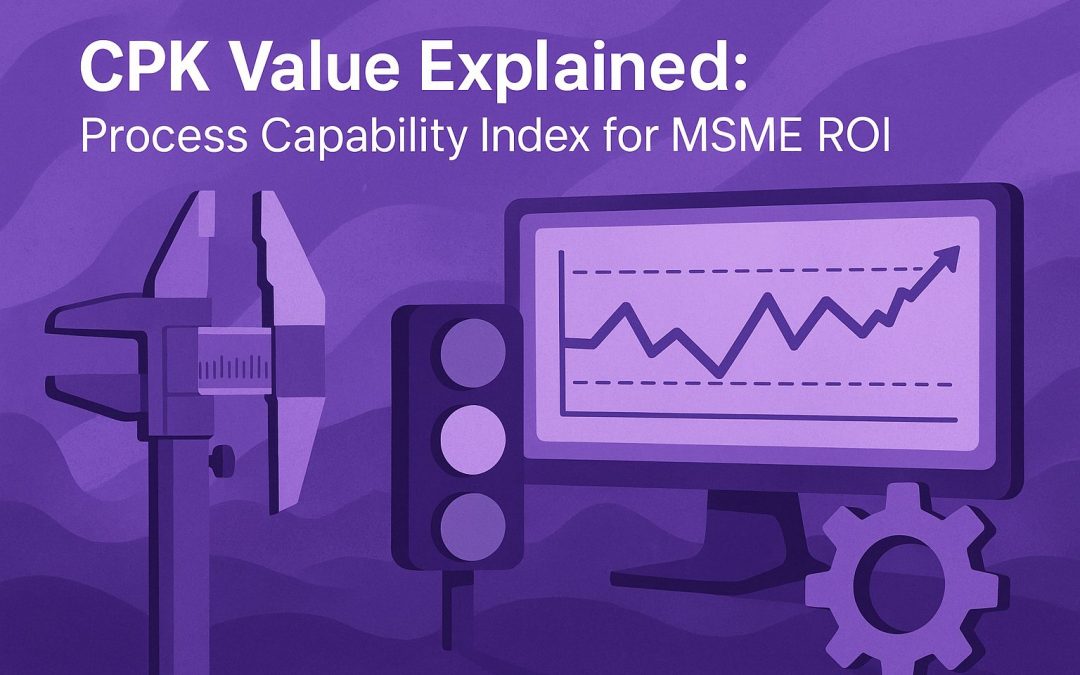
Most small factories in India chase the same dream: ship good parts on time, keep rework low, and satisfy demanding buyers. Yet many owners still treat CPK value—the process capability index—as an academic footnote rather than a profit lever. Buyers, auditors, and the Zero Defect Zero Effect (ZED) program, however, view it as proof of discipline.
When your process capability slips, scrap costs soar and tenders vanish. We see it every quarter: a casting unit fails a buyer audit, loses a ₹2 crore order, and wonders why a simple Cpk calculation was skipped. This guide turns that pain into a clear roadmap.
Our goal is practical. You will learn how to collect data, run the numbers, and link results to real savings. Along the way, we unpack control limits, Cp vs Cpk, and the hidden cost of poor quality (COPQ) in plain language.
Why CPK Value Matters for Indian MSMEs
Your process capability index tells buyers one blunt truth: can you hit spec every shift, or will they fund your scrap? A healthy CPK value above 1.33 separates repeat contracts from quiet phones. In Indian MSMEs, where margins hover near eight percent, a 0.2 dip in process capability index can erase an entire month’s profit. For exporters, capability scores decide custom-set lot sizes and inspection frequency.
Tender documents now list “minimum Cpk ≥ 1.33” beside delivery terms. OEM auditors walk lines, scan SPC charts, and flag lots drifting beyond control limits. Fail once and expect extra sampling, delayed payments, or—worse—blacklisting. Cp vs Cpk isn’t classroom theory; it is frontline defence for foundries, machine shops, and electronics assemblers. Every buyer reads the CPK value as a risk meter.
Regulators echo that drumbeat. The ZED framework rewards documented capability studies, while BIS teams demand real histograms, not slogans. Meeting the process capability index benchmark proves ISO 9001 readiness and trims third-party inspection costs. It also unlocks subsidies through SIDBI and state quality-upgrade schemes.
Left unchecked, poor capability leaks cash—scrap, rework, warranty claims, courier reruns. Surveys peg the cost of poor quality (COPQ) in micro enterprises at 3-5 percent of turnover. That sum can buy a new CNC or a year’s carbide inserts. Robust Cpk calculation and vigilant tracking of your CPK value cut defects per million opportunities and free funds for growth.
Most small businesses ignore capability until a shipment bounces. Use a strong CPK score as an early-warning siren. Train operators to log 30-50 data points per shift, review capability histograms weekly, and act before the next tender round. Each decimal you add to process capability index lands directly on the profit-and-loss line.
Step-by-Step Method to Calculate Your CPK
Getting a credible CPK value is simpler than most owners think. Follow three tight steps—collect data, crunch the numbers, then read the verdict. Each step matters; skip one and your process capability index loses meaning.
Gather the Right Data Fast
Most small businesses start with scattered readings scribbled on cardboard. Trade that chaos for a pocket notebook or, better, a shared Google Sheet. Capture 30 to 50 consecutive samples of the same feature—bore diameter, fill weight, response time—during normal production. Note machine ID, tool life, and shift conditions. This context protects your calculation from excuses later.
If your batch size is tiny, run the next order and pool the data—buyers accept that approach when you explain the constraint. Gauge accuracy matters too. A calibrated micrometer or a verified weighing scale costs under ₹3 000 and keeps Measurement System Analysis (MSA) critics silent.
Run the Numbers in Excel
Open Excel—no fancy software needed. Enter your data in Column A.
Use =STDEV.S(A:A) to find standard deviation.
Identify USL and LSL from the print or tender document.
Calculate Cp with
=(USL-LSL)/(6*STDEV.S).
Next, find the process mean with =AVERAGE(A:A).
Compute Cpl and Cpu:
=(MEAN-LSL)/(3*STDEV.S) and =(USL-MEAN)/(3*STDEV.S).
Your CPK value is =MIN(Cpl,Cpu).
Freeze the sheet as evidence for auditors; add a simple histogram using Excel’s built-in chart.
A Pune-based die-casting MSME followed this exact sheet during a BIS surveillance audit in March 2025. Their quick demonstration cut the audit from six hours to two and saved a ₹40 000 retest fee.
Interpret and Act
- CPK < 1.00 — Stop. Either widen specs or fix the tool.
- 1.00 ≤ CPK < 1.33 — Marginal. Track daily; plan a kaizen event.
- CPK ≥ 1.33 — Comfort zone. Reduce inspection frequency, pitch for new tenders.
Remember: Cp shows potential; CPK value shows reality by folding in centering error. A balanced process capability index spares you the hidden costs of scrap and rework, freeing capital for growth.
Affordable Tools and Gauges for Capability Studies
Before we crunch numbers, remember this: a CPK value is only as reliable as the instruments behind it. Good gauges don’t have to bankrupt a small shop, yet poor ones can sink the process capability index and credibility in a single audit. The tools below act as lean, audit-ready insurance that converts raw readings into capability proof buyers respect.
Budget-Friendly Gauges That Pass Audits
You don’t need a ₹5-lakh CMM to earn a solid CPK value. Start with a calibrated digital caliper, a dial bore gauge, and a bench micrometer—total spend under ₹12 000. Verify each tool with a gauge-block set every quarter; auditors love that logbook. This lean kit measures most dimensions an MSME tracks for its process capability index.
Low-Cost Digital SPC in Your Pocket
Skip pricey software licences. Free add-ins like QI Macros (trial) or LibreOffice’s Analysis-ToolPak run Cpk calculations straight from CSV data. Pair them with a ₹7 000 Raspberry Pi that collects readings over Bluetooth calipers and you have live SPC charts on any browser. A Coimbatore pump maker used this setup to broadcast control limits on a shop-floor TV and lifted its process capability from 0.98 to 1.45 in eight weeks.
Avoiding Measurement Pitfalls That Skew CPK
Don’t chase false precision. A shiny gauge without measurement system analysis (MSA) kills credibility. Run a simple gauge R&R: three operators, ten parts, two trials. If %R&R tops 10 %, tighten the setup before publishing your process capability index. Power cuts also corrupt readings—plug a ₹2 500 UPS into your data logger; losing five data points can drag your CPK value below the buyer cut-off. Finally, store tools away from coolant mist; thermal drift widens standard deviation and wipes out Cp vs Cpk gains.
Every rupee spent on solid gauges and data discipline shields lakhs in scrap, rework reduction, and stalled tenders.
Linking CPK to Indian Quality Schemes and Certifications
Strong numbers on the process capability index do more than impress buyers—they unlock subsidies, faster approvals, and lighter audits. When your CPK value sits above 1.33 and you can prove it, every door in India’s quality-upgrade maze opens a little quicker.
ZED: Turning Capability into Monetary Rewards
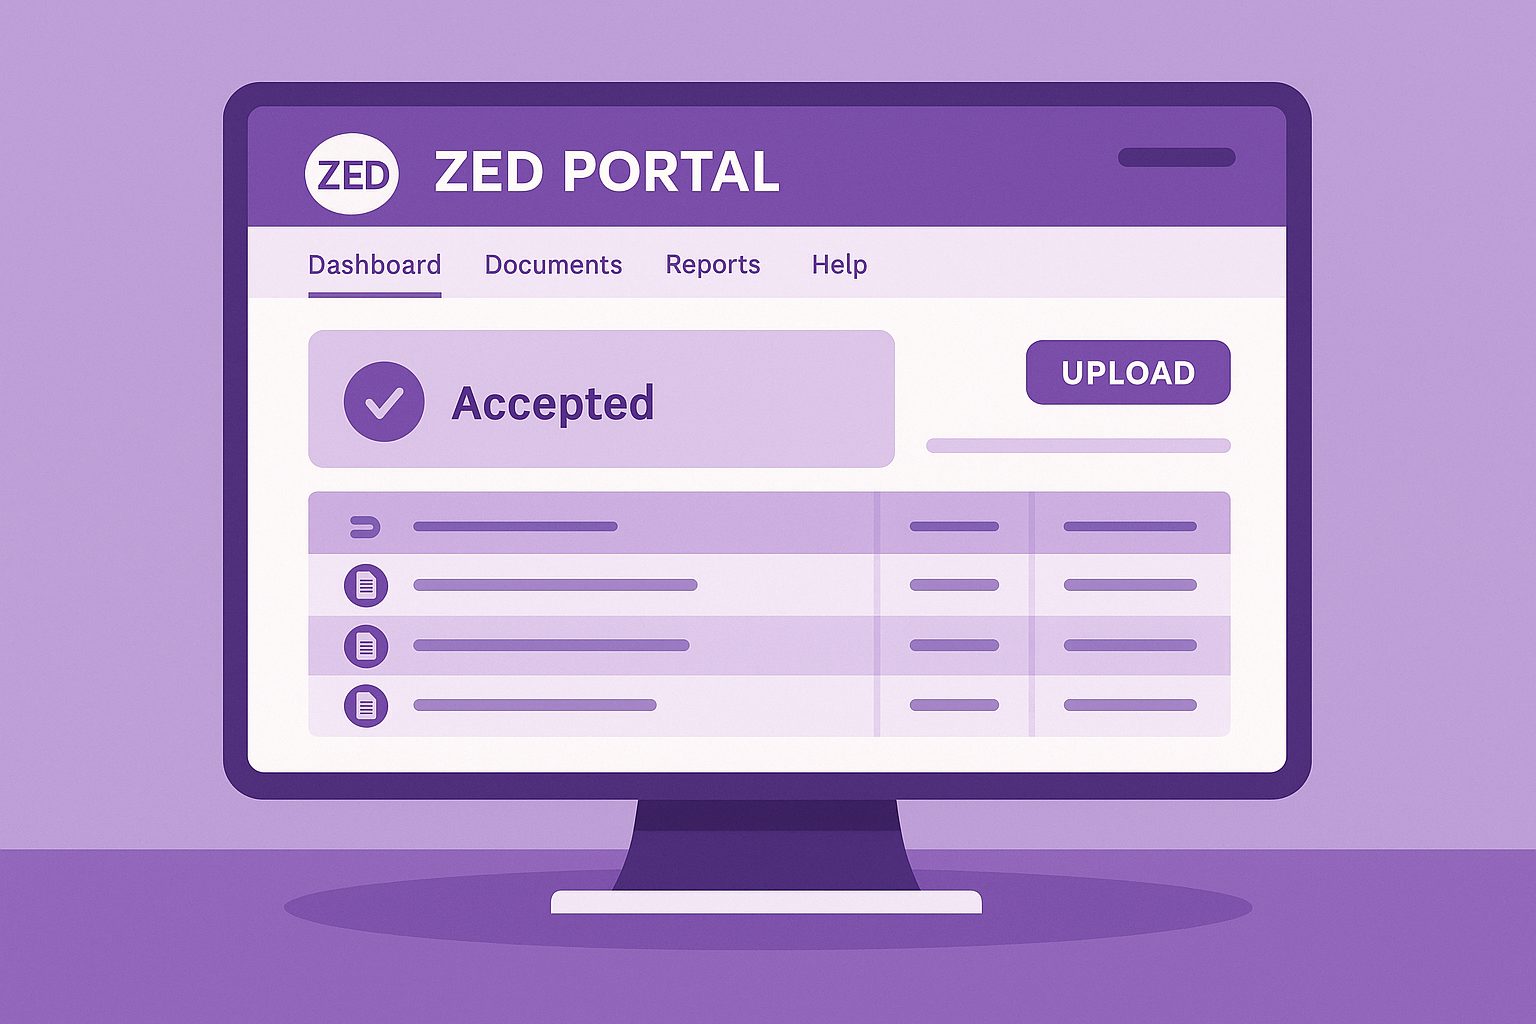
The Zero Defect Zero Effect (ZED) scheme assigns bonus points for published Cpk calculations and live SPC charts. A unit with documented process capability earns up to ₹25 lakh in technology-upgrade grants. Upload your histogram, gauge R&R report, and a month of control-chart screenshots to the ZED portal—no extra field visits required. One Kolhapur forging MSME shaved three weeks off certification by attaching a single Excel sheet that showed Cpk = 1.46.
BIS & ISO 9001: Document Once, Clear Twice
BIS inspectors and ISO auditors share a thirst for hard data. If your Cp vs Cpk study appears in the internal-audit folder, both agencies tick the box without duplicate sampling. Keep the Excel file, measurement system analysis, and calibration log in a cloud folder; share the link ahead of audits. This practice cut onsite time from six to two hours for a Gujarat ceramics unit last January—and saved a ₹60 000 re-inspection fee.
Tender Winning Playbook: Show Capability, Slash Inspection
Large OEMs and railways now add a “bonus” clause: Cpk ≥ 1.67 halves final-lot inspection. Meeting that mark shrinks dispatch lead times by two days and frees working capital. A Chennai EMS start-up won a ₹1.8 crore annual contract by presenting a live SPC dashboard during the technical bid meeting—the buyer waived third-party inspection, citing the visible CPK value trend.
Linking your process capability index to national schemes and tender checklists turns math into money: lower audit fees, faster certifications, and contracts that pay on time—proof that capability pays twice, once in quality and again in cash flow.
Converting Capability into Profit: Success Stories
The CPK value is more than a metric—it behaves like currency. Raise the number, and lenders, buyers, even auditors treat your shop with new respect. Three recent MSME stories prove how a disciplined process capability index translates into fast, measurable profit.
Foundry Cuts Scrap, Adds ₹48 Lakh to Bottom Line
A Kolhapur casting unit made crankcase blanks for two OEMs. In 2023 its process capability index averaged 0.92; scrap hovered near nine percent. Management launched a 10-week sprint: upgraded sand-lab gauges, ran daily Cpk calculations, and tuned pouring temperature. CPK climbed to 1.44. Scrap plunged to 1.8 %. Saved metal alone freed ₹48 lakh in six months—enough to pay off a new shot-blast machine.
A surprise bonus followed. The OEM extended blanket orders and waived final‐lot inspection because the plant’s SPC dashboard stayed green for 60 days. Cash rotation improved by five days, cutting overdraft interest by another ₹2 lakh a quarter.
EMS Start-up Wins Tender, Slashes Inspection Time
A Chennai electronics manufacturer built control panels in batches of 200. Its buyer demanded Cp vs Cpk evidence above 1.67 for solder joint height. By installing a ₹7,000 Bluetooth micrometer and live SPC chart, the team hit 1.71. During bid review, engineers streamed the dashboard directly to the conference screen. The buyer waived third-party verification, citing the live process capability index trend. Dispatch cycle shrank by two days; the start-up closed a ₹1.8 crore annual contract with zero added quality-lab staff.
Continuous-Improvement Loop: Small Steps, Big Gains
Both firms kept climbing. Weekly capability reviews now feed a kaizen board. Operators flag any CPK value dip below 1.33 within an hour. Maintenance reacts before scrap appears. This culture shift, not the spreadsheet alone, locks gains in place. Over twelve months the casting unit lifted overall equipment effectiveness (OEE) by seven points, while the EMS plant used capability data to justify a low-interest SIDBI loan for an SMT line—secured in half the usual paperwork time because auditors trusted the numbers.
Better capability pays twice: once in direct defect savings, again in faster deals and cheaper capital. For MSMEs, that double dividend often funds the next growth leap.
Conclusion
Raising your CPK value is not a vanity metric—it slashes cost, speeds audits, and convinces buyers you run a disciplined line. Treat the process capability index like a live health score, not a quarterly ritual.
Quick Wins for the Coming Month
- Collect 50 samples this week. Log them in Excel, run the Cpk calculation, and chart a simple capability histogram.
- Verify gauges. Calibrate callipers and micrometers; finish a basic gauge R&R before next buyer visit.
- Pin capability to money. Compare COPQ before and after each tweak; show staff the rupee payoff.
- Publish results. Add live SPC charts to your ZED or BIS folders—auditors love easy evidence.
- Review weekly. If the process capability index drifts below 1.33, trigger a kaizen huddle within 24 hours.
Follow these steps, and your shop will convert capability into profit—one decimal point, one contract, and one subsidy at a time.
FAQs
Can I use free online SPC calculators without violating data security rules?
What’s the quickest way to train operators on Cpk basics?
How often should I recalibrate low-cost digital calipers?
Do capability studies apply to service MSMEs like repair shops?
Is there a shortcut to estimate Cpk when batch sizes are under ten?
Can I claim a tax deduction on SPC software?
What if the customer’s spec tolerance is too tight for my current process?
How do I link my ERP to real-time capability dashboards?
Which government body verifies Cpk claims during loan applications?
Can a single out-of-control point cancel my ZED score?
Ananya Mittal blends a background in data science with a passion for writing, contributing to Tata Nexarc’s efforts in creating insightful, data-informed content for MSMEs. Her work focuses on exploring sector-specific challenges and opportunities across procurement, logistics, and business strategy. She is also involved in leveraging analytics to strengthen content performance and deliver actionable insights to India's growing B2B ecosystem.







Cpk has been something we only see in OEM audits. This article describes it so simply and explains how we as MSMEs can use it to measure and improve our quality targets. Would love to see a part two with examples using actual production data.
Thanks for the visual representations. That’s quite easy and quick to understand.